




Track the Week’s Top Market Performers
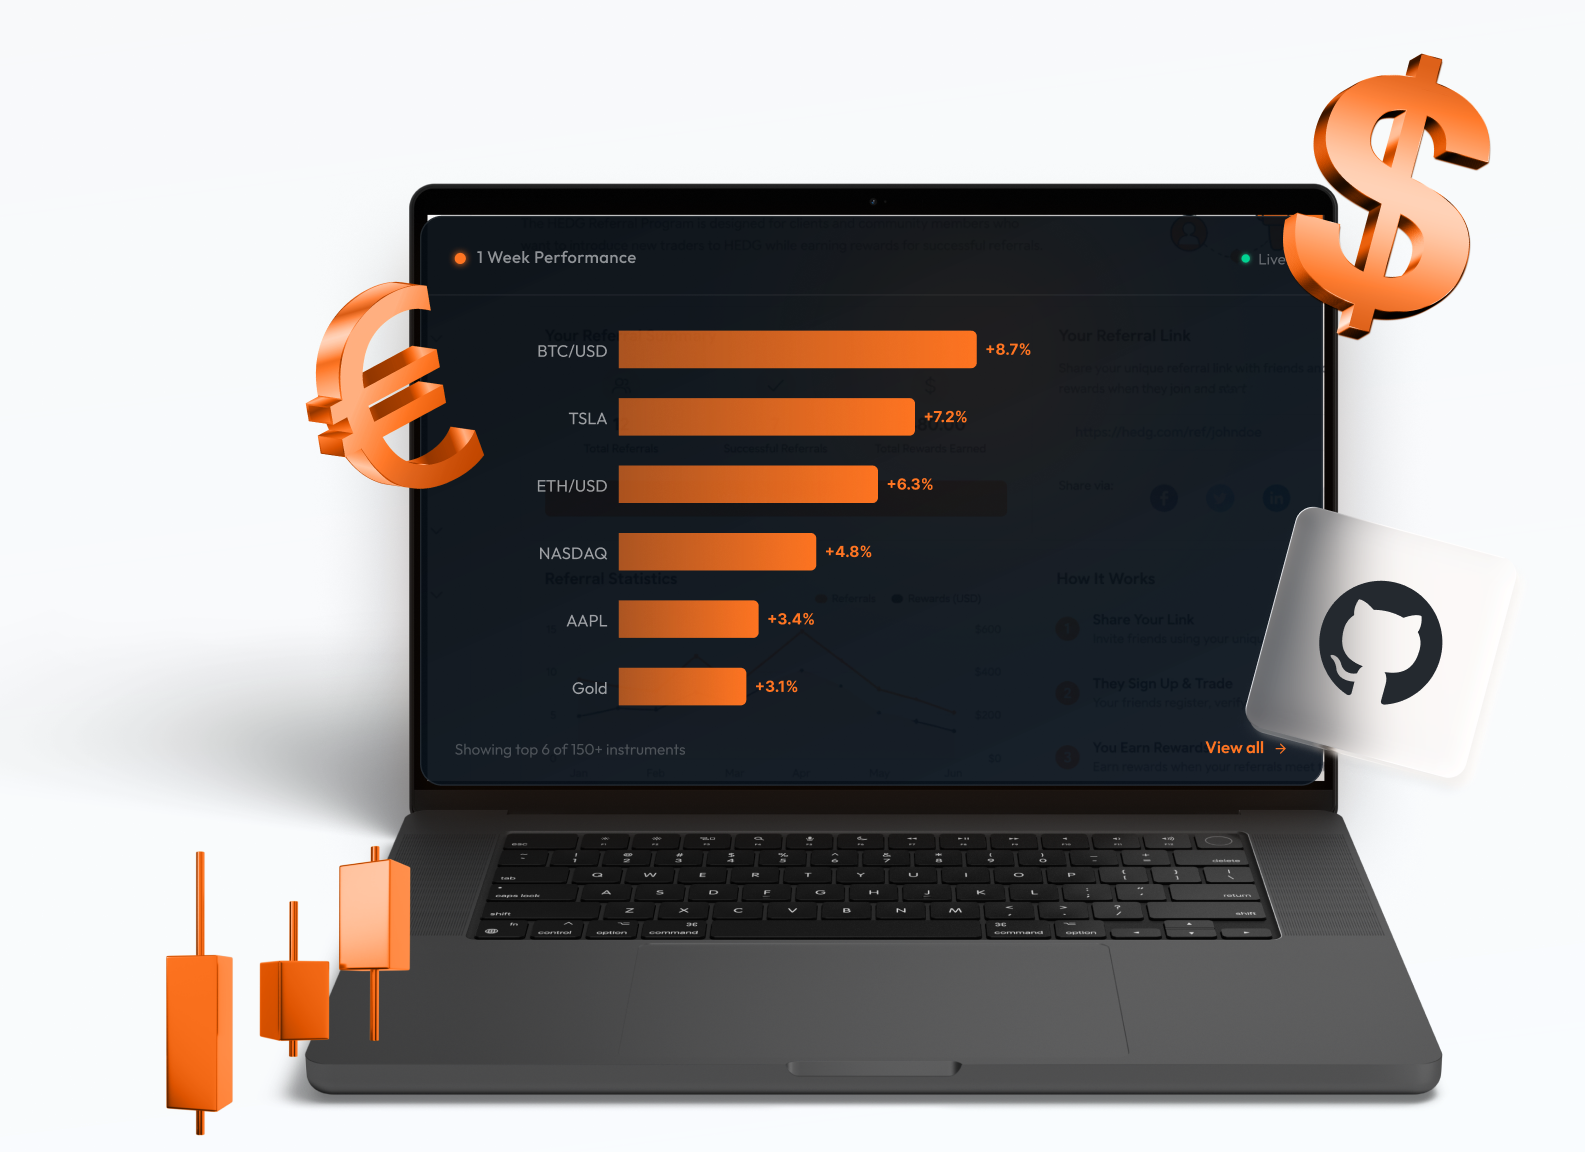
Stay updated with a clear view of the assets showing the strongest movement this week. HEDG’s Performance Charts help you follow market momentum across leading instruments and identify where activity is building.


Follow Market Momentum
Use HEDG’s Performance Charts to monitor assets with the strongest weekly performance. The chart gives you a quick way to compare market movement, review active instruments, and stay informed as trends develop throughout the week.
Explore Top PerformersKey Points
- Compare weekly movement across multiple instruments at a glance
- Identify which asset classes are generating the most activity
- Monitor trending instruments as the week develops
- Use performance data to stay informed before making decisions

What You Can Track
HEDG’s Performance Charts may include a range of financial instruments, such as:

Stocks
Top-performing equities from global markets tracked over the selected weekly period.

Forex pairs
Major, minor and exotic currency pairs showing the strongest weekly movement.

Indices
Global market indices including S&P 500, NASDAQ, FTSE and more.

Cryptocurrencies
Digital assets showing notable price activity during the selected window.

Commodities
Energy, metals, and agricultural commodities with notable weekly shifts.

Other available market instruments
Additional instruments available through HEDG’s trading platform.